Website Design
Modified:
Introduction
I enjoyed designing this website! I have built it using free or free versions of plugins, with the exception of Code Block Pro, as I was fussy about which code colour scheme I wanted to use, and it was not expensive.
When I started this website I did not have a specific vision of how I would architect it. My previous website used simple posts and pages and a small number of supporting plugins, such as breadcrumbs, avatars, social media icons, backup, etc.
I was initially lured in by the flashy features offered by enhanced block plugins like Elementor, which led me to use a similar framework: Gutenverse. At the time, Gutenverse was mostly free and easy to use. But as it evolved, ‘pro features’ were gradually mixed in with the free ones, which ended up cluttering the interface and turning a clean UI into a confusing mess. In addition to that, every update forced me to relearn how to use it.
As I continued building and developing the website, I became more confident creating effects with CSS and JavaScript. I eventually decided to get rid of Gutenverse, so I carefully unpicked all Gutenverse dependencies and ripped it out entirely.
Components / Plugins
Initially I wanted to minimise the number of plugins I used for the design of this website, as each additional plugin can increase potential security vulnerabilities and possibly degrade site performance. I kept discovering very useful plugins however, and as I started to realise what I could do with them, I expanded the functionality of the website. As this is a personal hobby website with no sensitive data or user accounts, security is not a primary concern, although I do use Wordfence and other methods to secure the website as well as I can.
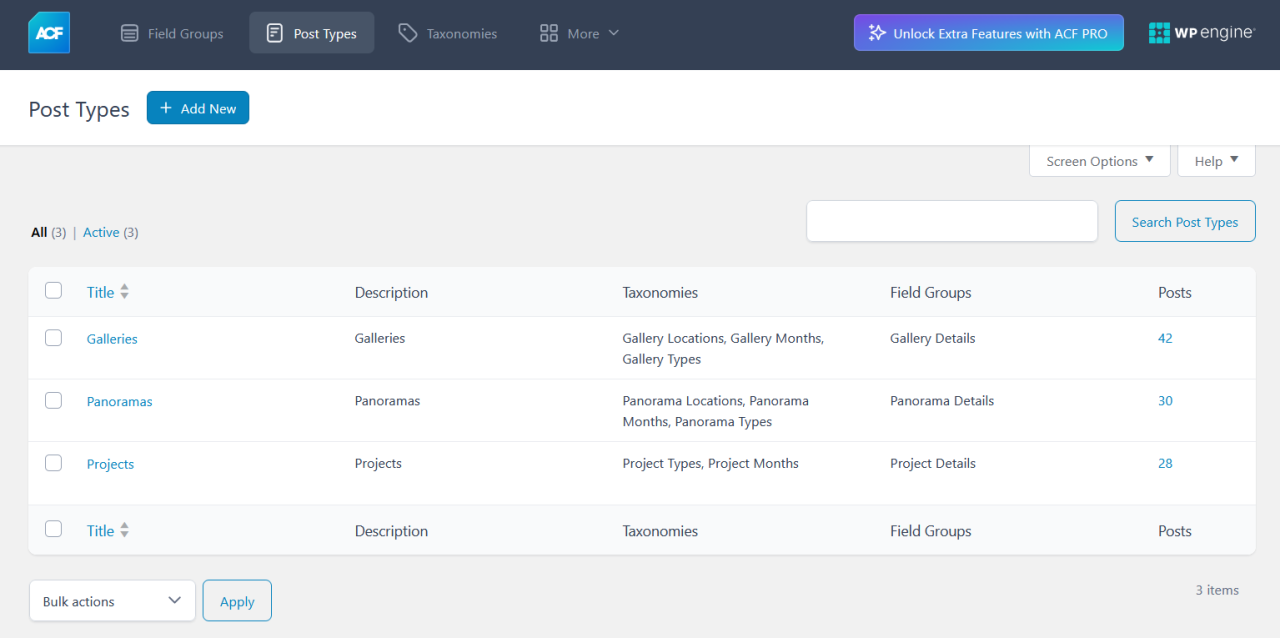
The core plugins powering this site’s dynamic content framework are Advanced Custom Fields (for defining custom post types, taxonomies and fields), Advanced Views Lite (for retrieving and placing ACF values), and Filter Everything (for searching and filtering custom post type archives).
Advanced Custom Fields (ACF)
- Custom Post Types: Projects, Panoramas, Galleries
- Field Groups: Groups of custom fields assigned to custom posts types
- Taxonomies: Categorisation assigned to custom post types
If you’re using a modern block-based theme like Twenty Twenty-Four, creating custom post types enables you to build templates for both archive and single post views. Custom fields and taxonomies associated with those post types can be accessed and displayed within those templates using block bindings or dynamic content features.
Advanced Views Lite
- Views: Returning ACF fields using shortcodes.
- Cards: Templated HTML layouts to render Advanced Custom Fields returned from a view – I don’t use this.
I use this plugin to simply return the value of an ACF field in the custom post template.
Filter Everything
This plug in allows you to filter custom post type archive pages, and presents a list of configurable filters on the page. Take a look at my Projects, Panoramas and Galleries Filter pages.
ACF: Better Search
This plugin enhances WordPress search by indexing and querying ACF fields for more accurate, field-aware results.
Other Useful Plugins
- Shortcoder: Embedding HTML, CSS and JavaScript into a specific page / section using shortcodes
- WP Code Snippets: Site wide scripts – supports PHP.
- Ultimate Before After Image Slider & Gallery: Self explanatory.
- Code Block Pro: Rendering pretty code.
- Forminator: Contact form
- Post Timeline: Showing posts in a timeline format, chronologically.
- Meow Lightbox: Adds lightbox viewing for photos, complete with metadata and comment integration.
- BackWPup: Granular backup for the website including the database.
Enhanced Google Gantt Chart
Not a plugin. This was a nice little project – it’s essentially a script that uses Google’s timeline / Gantt feature, embedded by Shortcoder and can be seen on my Projects > Gantt page.
I had help from Copilot on this, but ultimately I needed to understand what I wanted to achieve and what was possible. The following code is saved as a Shortcoder script and relies on the custom post type ‘Projects’ along with its associated ACF fields. I could not get the Date range to be on top which I feel would have been better. Feel free to re-use or adapt it.
<link href="https://fonts.googleapis.com/icon?family=Material+Icons" rel="stylesheet">
<link href="https://fonts.googleapis.com/css2?family=Material+Symbols+Outlined" rel="stylesheet">

<script src="https://www.gstatic.com/charts/loader.js"></script>
<div class="buttons">
  <button id="minus-button" title="Decrease Scale">
    <span class="material-icons">zoom_out</span>
  </button>
  <button id="plus-button" title="Increase Scale">
    <span class="material-icons">zoom_in</span>
  </button>
  <span style="width: 10px; display: inline-block;"></span>
  <button id="fit" title="Fit to Width">
    <span class="material-symbols-outlined">fit_page_width</span>
  </button>
  <span style="width: 10px; display: inline-block;"></span>
  <button id="one" title="Zoom Level 1">
    <span class="material-symbols-outlined">counter_1</span>
  </button>
  <button id="two" title="Zoom Level 2">
    <span class="material-symbols-outlined">counter_2</span>
  </button>
  <button id="three" title="Zoom Level 3">
    <span class="material-symbols-outlined">counter_3</span>
  </button>
  <span style="width: 10px; display: inline-block;"></span>
  <button id="home" title="Scroll to Left">
    <span class="material-icons">first_page</span>
  </button>
  <button id="end" title="Scroll to Right">
    <span class="material-icons">last_page</span>
  </button>

  <span class="instructions" style="padding-left: 50px;"> Drag or use Shift + Mouse Wheel to Pan | Plus or Minus
    buttons to scale | Select an
    item to navigate to the relevant page</span>
</div>
<div class="scroll-container" id="scroll-container">
  <div id="timeline" class="chart-content"></div>
</div>

<style>
  .instructions {
    font-size: 14px;
  }

  .scroll-container {
    width: 99%;
    /* Sets a percentage of the width of the parent container, which is the page. */
    overflow: auto;
    border: 1px solid #777;
    position: relative;
    overflow-x: auto;
    overflow-y: hidden;
    margin-left: 10px;
  }

  .chart-content {
    width: 100%;
    /* This width sets the default time scaling of the timeline that is manupulated by the buttons */
  }

  #timeline text {
    fill: #fff !important;
  }

  /* For WebKit-based browsers (Chrome, Edge, Safari) */
  .scroll-container::-webkit-scrollbar {
    width: 12px;
    /* Width of the scrollbar */
    height: 12px;
    /* Height of the scrollbar */
  }

  .scroll-container::-webkit-scrollbar-track {
    background: #222;
    /* Dark background for the scrollbar track */
    border-radius: 6px;
    /* Rounded edges */
  }

  .scroll-container::-webkit-scrollbar-thumb {
    background: #c84a0c;
    /* Orange thumb */
    border-radius: 6px;
    /* Rounded thumb for smooth appearance */
  }

  .scroll-container::-webkit-scrollbar-thumb:hover {
    background: #e69500;
    /* Darker orange when hovered */
  }

  /* For Firefox */
  .scroll-container {
    scrollbar-width: thin;
    /* Makes the scrollbar thinner */
    scrollbar-color: #c84a0c #222;
    /* Thumb color (orange) and track color (#222) */
  }

  .buttons {
    padding-bottom: 0px;
    padding-left: 20px;
  }

  button {
    background-color: #c84a0c;
    /* Set the background color */
    color: white;
    /* Set the text color */
    border: none;
    /* Remove the border for a flat design */
    border-radius: 5px;
    /* Add rounded edges */
    padding: 5px 12px 2px 12px;
    /* Add padding for a better appearance */
    font-size: 16px;
    /* Set font size for readability */
    cursor: pointer;
    /* Change cursor to pointer on hover */
    outline: none;
    /* Remove the outline on focus */
    transition: background-color 0.3s;
    /* Add a smooth transition effect */
  }

  button:hover {
    background-color: #a83c08;
    /* Darken the background color on hover */
  }
</style>

<script>
  // Load Google Charts
  google.charts.load("current", {
    packages: ["timeline"]
  });
  google.charts.setOnLoadCallback(drawChart);

  function decodeHtmlEntities(encodedString) {
    var textArea = document.createElement('textarea');
    textArea.innerHTML = encodedString;
    return textArea.value;
  }

  function drawChart() {
    const container = document.getElementById("timeline");
    const chart = new google.visualization.Timeline(container);
    const dataTable = new google.visualization.DataTable();
    dataTable.addColumn({
      type: "string",
      id: "URL"
    });
    dataTable.addColumn({
      type: "string",
      id: "Name"
    });
    dataTable.addColumn({
      type: "date",
      id: "Start"
    });
    dataTable.addColumn({
      type: "date",
      id: "End"
    });
    // Ensure the 'projects' variable exists - this is generated by a PHP script in Code Snippets
    if (typeof projects !== 'undefined' && Array.isArray(projects)) {
      const reversedProjects = [...projects].reverse(); // Reverse the order of projects, as they are naturally rendered upside down.
      reversedProjects.forEach(project => {
        var startY = parseInt(project.start_date.substring(0, 4), 10);
        var startM = parseInt(project.start_date.substring(4, 6), 10) - 1; // Subtract 1 to make month zero-based
        var startD = parseInt(project.start_date.substring(6, 8), 10);
        dataTable.addRows([
          [project.url, decodeHtmlEntities(project.title), new Date(startY, startM, startD), new Date(project.publish_date)]
        ]);
      });
    } else {
      console.error('The Projects data is not available - check the code snippet that extracts it.');
    };
    // Calculate height dynamically based on the number of rows
    const rowHeight = 43; // Estimate of each row's height in pixels
    const numRows = dataTable.getNumberOfRows();
    const chartHeight = numRows * rowHeight + 50; // Total height plus padding for the date legend
    container.style.height = chartHeight + "px"; // Set the container's height
    var options = {
      timeline: {
        singleColor: '#bc9026', //'#C84A0C',
        showRowLabels: false,
        colorByRowLabel: true,
        groupByRowLabel: false
      },
      backgroundColor: {
        fill: "#293138"
      },
      hAxis: {
        // minValue: new Date(1780, 11, 1), // Start of the timescale
        // maxValue: new Date(2000, 5, 30) // End of the timescale
      },
      tooltip: {
        isHtml: false,
        trigger: 'none'
      } // Disable tooltip
    };
    //google.visualization.events.addListener(chart, "ready", function() {
    //  console.log("Chart is ready!");
    //});
    chart.draw(dataTable, options);
    let selected = false;
    google.visualization.events.addListener(chart, "select", function() {
      if (!wasDragging) {
        selected = true;
        var row = chart.getSelection()[0].row;
        var url = dataTable.getValue(row, 0);
        //window.open(url, "_blank"); // Open the URL in a new tab, but leaves the cursor busy.
        window.location.href = url; // Open the URL in the same tab
      }
    });
    google.visualization.events.addListener(chart, "onmouseover", function() {
      if (!selected) {
        container.style.cursor = "pointer";
      }
    });
    google.visualization.events.addListener(chart, "onmouseout", function() {
      if (selected) {
        container.style.cursor = "wait";
      } else {
        container.style.cursor = "grab";
      }
    });
    // Add drag-to-scroll functionality after the chart is rendered
    enableDragToScroll();
  }
  let wasDragging = false;

  function enableDragToScroll() {
    const scrollContainer = document.getElementById("scroll-container");
    let isDragging = false;
    let startX, startY;
    let scrollLeft, scrollTop;
    // Mouse down to start dragging
    scrollContainer.addEventListener("mousedown", (e) => {
      wasDragging = false;
      isDragging = true;
      startX = e.pageX - scrollContainer.offsetLeft;
      //startY = e.pageY - scrollContainer.offsetTop;
      scrollLeft = scrollContainer.scrollLeft;
      //scrollTop = scrollContainer.scrollTop;
      scrollContainer.style.cursor = "grabbing";
      e.preventDefault(); // Prevent text selection
    });
    // Mouse move for dragging
    scrollContainer.addEventListener("mousemove", (e) => {
      if (!isDragging) return;
      wasDragging = true;
      const x = e.pageX - scrollContainer.offsetLeft;
      //const y = e.pageY - scrollContainer.offsetTop;
      const walkX = (x - startX) * 1; // Adjust drag sensitivity
      //const walkY = (y - startY) * 1;
      scrollContainer.scrollLeft = scrollLeft - walkX;
      //scrollContainer.scrollTop = scrollTop - walkY;
    });
    // Stop dragging on mouse up
    scrollContainer.addEventListener("mouseup", () => {
      isDragging = false;
      scrollContainer.style.cursor = "grab";
    });
    // Pass vertical scroll events on the chart to the web page itself but allow for horizontal scrolling while holding shift.
    const div = document.getElementById("scroll-container");
    div.addEventListener("wheel", (event) => {
      if (event.shiftKey) {
        window.scrollBy(event.deltaY, 0); // Scroll horizontally if Shift key is pressed
      } else if (event.deltaY !== 0) {
        window.scrollBy(0, event.deltaY); // Scroll vertically otherwise
        event.preventDefault();
      }
    });
    // Stop dragging if the mouse leaves the container
    scrollContainer.addEventListener("mouseleave", () => {
      isDragging = false;
      scrollContainer.style.cursor = "grab";
    });
    // Initial cursor style
    scrollContainer.style.cursor = "grab";
  }
  // Add event listeners for the Plus and Minus buttons
  document.getElementById("plus-button").addEventListener("click", () => {
    const chartDiv = document.getElementById("timeline");
    const currentWidth = chartDiv.offsetWidth;
    const step = 200; // Amount to grow per click
    chartDiv.style.width = currentWidth + step + "px";
    // Refresh the Google Chart
    drawChart();
  });
  document.getElementById("minus-button").addEventListener("click", () => {
    const chartDiv = document.getElementById("timeline");
    const currentWidth = chartDiv.offsetWidth;
    const step = 200; // Amount to shrink per click
    chartDiv.style.width = Math.max(100, currentWidth - step) + "px"; // Minimum width of 100px
    // Refresh the Google Chart
    drawChart();
  });
  document.getElementById("home").addEventListener("click", () => {
    const chartContainer = document.getElementById("scroll-container");
    chartContainer.scrollLeft = 0; // Scrolls all the way to the far left
  });
  document.getElementById("end").addEventListener("click", () => {
    const chartContainer = document.getElementById("scroll-container");
    chartContainer.scrollLeft = chartContainer.scrollWidth - chartContainer.clientWidth; // Scrolls all the way to the far right
  });
  document.getElementById("fit").addEventListener("click", () => {
    const chartContainer = document.getElementById("scroll-container");
    const chartDiv = document.getElementById("timeline");
    chartDiv.style.width = `${chartContainer.offsetWidth - 2}px`;
    drawChart();
  });
  document.getElementById("one").addEventListener("click", () => {
    const chartContainer = document.getElementById("scroll-container");
    const chartDiv = document.getElementById("timeline");
    chartDiv.style.width = `${chartContainer.offsetWidth * 2}px`;
    drawChart();
  });
  document.getElementById("two").addEventListener("click", () => {
    const chartContainer = document.getElementById("scroll-container");
    const chartDiv = document.getElementById("timeline");
    chartDiv.style.width = `${chartContainer.offsetWidth * 5}px`;
    drawChart();
  });
  document.getElementById("three").addEventListener("click", () => {
    const chartContainer = document.getElementById("scroll-container");
    const chartDiv = document.getElementById("timeline");
    chartDiv.style.width = `${chartContainer.offsetWidth * 10}px`;
    drawChart();
  });
  let resizeInterval; // To store the interval ID
  let step = 500; // Amount to shrink per interval
  // Add continuous resize functionality for the Plus button
  document.getElementById("plus-button").addEventListener("mousedown", () => {
    clearInterval(resizeInterval); // Clear any previous interval
    resizeInterval = setInterval(() => {
      const chartDiv = document.getElementById("timeline");
      const currentWidth = chartDiv.offsetWidth;
      chartDiv.style.width = currentWidth + step + "px";
      drawChart(); // Refresh the chart dynamically
    }, 100); // Adjust width every 100ms
  });
  // Add continuous resize functionality for the Minus button
  document.getElementById("minus-button").addEventListener("mousedown", () => {
    clearInterval(resizeInterval); // Clear any previous interval
    resizeInterval = setInterval(() => {
      const chartDiv = document.getElementById("timeline");
      const currentWidth = chartDiv.offsetWidth;
      chartDiv.style.width = Math.max(100, currentWidth - step) + "px"; // Minimum width of 100px
      drawChart(); // Refresh the chart dynamically
    }, 100); // Adjust width every 100ms
  });
  // Stop resizing when the mouse button is released
  document.addEventListener("mouseup", () => {
    clearInterval(resizeInterval); // Stop the interval
  });
</script>Neon Welcome Sign
At a certain point in this website design, after seeing Farjana Rashid’s tutorial on how to create a glowing / neon effect, I decided to build a neon welcome sign.
It consists of two labels superimposed on each other (negative top margin) with a slight offset (left margin) and a background image (bricks). A CSS animation modifies the label colour and shadow properties, while another CSS animation applies a radial gradient mask on the background image.
I got so caught up in the design of it that I did not realise that it is a serious accessibility issue in that it could potentially cause issues for anyone sensitive to flashing, so I removed it.
I have put it in below with the option to play the animation which I believe meets WCAG guidelines. In retrospect I could have done this on the homepage, but having the homepage load without the animation would have lost the impact.
NOTE: Don’t play this animation if you are sensitive to flashing.

The above is now an animated GIF, but below is the final CSS code originally used for the sign. I changed it to an animated GIF as updates kept breaking it.
 /* Neon Text */
 :root{
     --dark: #293138;
     --white: #FFFCCC;
     --glow: #E0823B;
     --pipe: #FAFAFA36;
 }

 .neon-display {
     z-index: 10;
     animation: animate-neon 5s linear infinite;
 }

 .neon-display .guten-background-overlay {
     animation: animate-bg 5s linear infinite;
 }

 .neon-display-shadow {
     animation: animate-shadow 5s linear infinite;
 }

 @keyframes animate-neon {
     0%, 18%, 20%, 50.1%, 60%, 65.1%, 80%, 90.1%, 92% {
         color: var(--pipe);
         text-shadow: none;
     }

     18.1%, 20.1%, 30%, 50%, 60.1%, 65%, 80.1%, 90%, 92.1%, 100% {
         color: var(--white);
         text-shadow: 0 0 10px var(--glow),
             0 0 20px var(--glow),
             0 0 40px var(--glow),
             0 0 80px var(--glow),
             0 0 160px var(--glow),
             0 0 320px var(--glow);
     }
 }

 @keyframes animate-bg {
     0%, 18%, 20%, 50.1%, 60%, 65.1%, 80%, 90.1%, 92% {
         mask-image: radial-gradient(ellipse at 50% 50%, rgba(255,255,255,.1) 0%, rgba(0,0,0,1) 0%);
         -webkit-mask-size: 100% 100%;
     }

     18.1%, 20.1%, 30%, 50%, 60.1%, 65%, 80.1%, 90%, 92.1%, 100% {
      mask-image: radial-gradient(ellipse at 50% 50%, rgba(255,255,255,.1) 0%, rgba(0,0,0,1) 70%);
      -webkit-mask-size: 100% 100%;
     }
 }

 @keyframes animate-shadow {
    0%, 18%, 20%, 50.1%, 60%, 65.1%, 80%, 90.1%, 92% {
        color: var(--dark);
        text-shadow: none;
    }

    18.1%, 20.1%, 30%, 50%, 60.1%, 65%, 80.1%, 90%, 92.1%, 100% {
        color: var(--pipe);
        text-shadow: 0 0 10px var(--glow);
    }
}Archived Websites
See my old websites going back over the years! Most are pretty sparse. Back then I was just experimenting. Things got a bit more serious when I discovered WordPress and built the 2016 version of my website, although I still didn’t add much content at the time.
Now, inspired by what I’ve been able to achieve with this latest version, I’ve made it a mission to finally publish all the relevant content I’ve created to date.
Credits
- Text Carousel: Pure CSS Carousel, by Ustariz Enzo (no longer used)
- Neon welcome base CSS code from Farjana Rashid and Rachel Andrew
- Vanta Animated Background (Home page): Vanta.js
- Cylindrical Panorama Viewer: Paver by Terry Mun, GitHub
- Spherical Panorama Viewer: Panellum by Matthew Petroff, GitHub
- 3D Viewer: 3dviewer.net by István Kovács, Github
- Free plugins generously provided by various developers and organizations